 Journal of Global Trade, Ethics and Law
1. Introduction
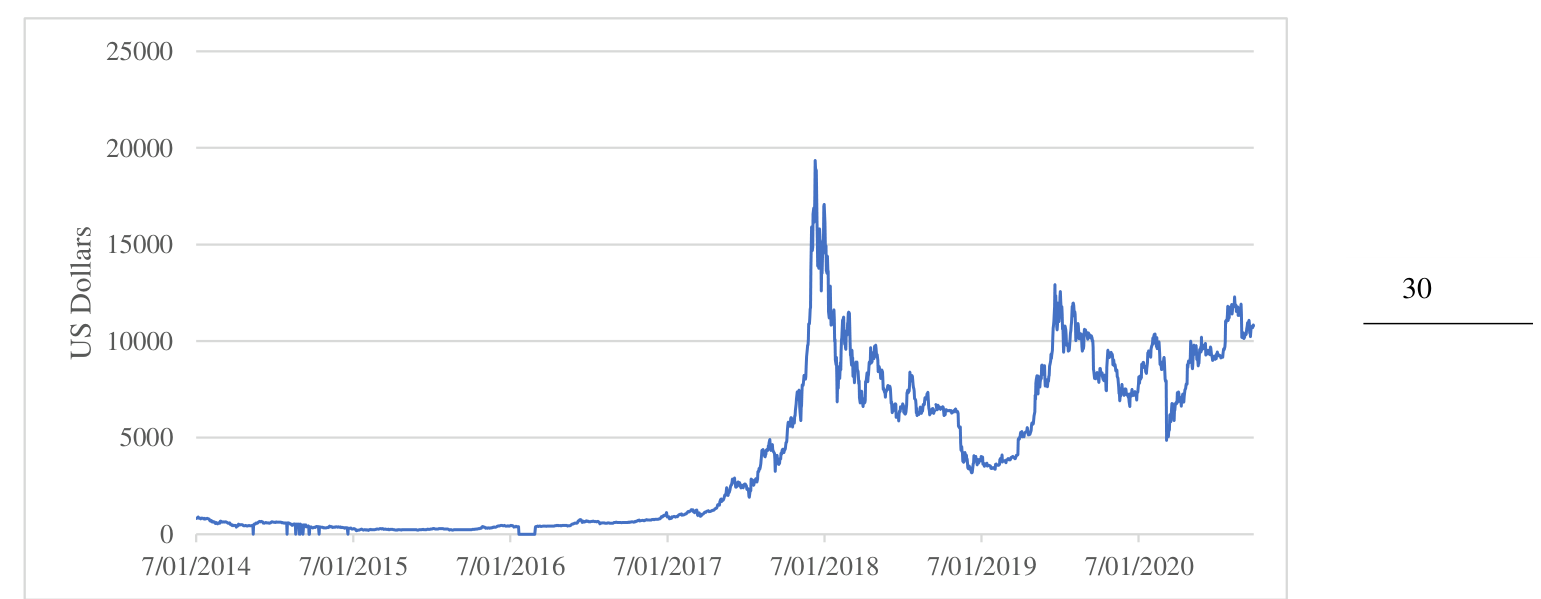
In just 12 years, an idea proposed by Satoshi Nakamoto (2009) for Bitcoin, a peer-topeer payment system outside of government control, with no need for conventional financial institutions has morphed into a cryptocurrency market with an estimated 101 million crypto users globally, holding 191 million accounts.1 It has led to the development of thousands of cryptocurrencies with around 5,000 actively traded. Bitcoin was the first and still is the leading cryptocurrency in terms of market capitalisation, which is estimated at approximately US$211 billion.2 It is traded peer-to-peer around the world in 248 countries3 and on cryptocurrency exchanges in all the major currencies. Figure 1 shows its bumpy ride since it reached its peak of US$19,300 in December 2017, after starting life in 2009 at just a few cents.
Research relating to the impact on Bitcoin, of the COVID-19 pandemic, concentrates on the correlation of the Bitcoin price, as given by the United States (US) dollar, with US stocks and the US S&P 500 index. Both Grobys (2020) and Conlon and McGee (2020) find a strong correlation in the early months of 2020. This relationship negates the use of Bitcoin as a safe haven at times of economic uncertainty. Many of the early studies of Bitcoin behaviour as COVID-19 develops rely on US dollar transactions and even though Conlon, Corbet and McGee (2020) test Bitcoin, Ethereum and Tether as safe havens during COVID-19 they still use US dollar trade prices in their analysis.
1 Section 4 of the 3rd Global Cryptoasset Benchmarking Study, September 2020. Judge Business School, University of Cambridge.
2 From bitcoincharts.com on 20/10/2020. 3 From localbitcoins.com that lists 248 countries in which trading takes place in date 10/10/2020.
Johnson (2020a) widens the tests of Bitcoin’s relationship with stock indices by including five currencies, the US dollar, the UK pound, the European euro, the Japanese yen and the Australian dollar, and their respective stock indices. She finds the highest correlation is with the S&P 500 when bitcoin trading is restated in US dollars. Relationships are not as strong when trading in local currencies and assessed against local stock indices.
The aim here is to compare Bitcoin trading behaviour pre- and post- COVID-19 in four currencies, excluding the US dollar which is covered in Johnson (2020b), to see if there is any consistency across currencies or whether trading behaviour is more a reflection of each country’s economic conditions. The Bitcoin price may be universal but Bitcoin trading in local currencies can reflect local conditions.
Section 2 covers both the data used in the analysis and the techniques used to compare pre- and post-COVID-19 behaviour. Section 3 is the analysis of each individual currency, highlighting any idiosyncrasies that are observed in each currency’s trading behaviour. Section 4 brings the currencies together so a comparison can be made and Section 5 is the conclusion.
2. Data & Methodology
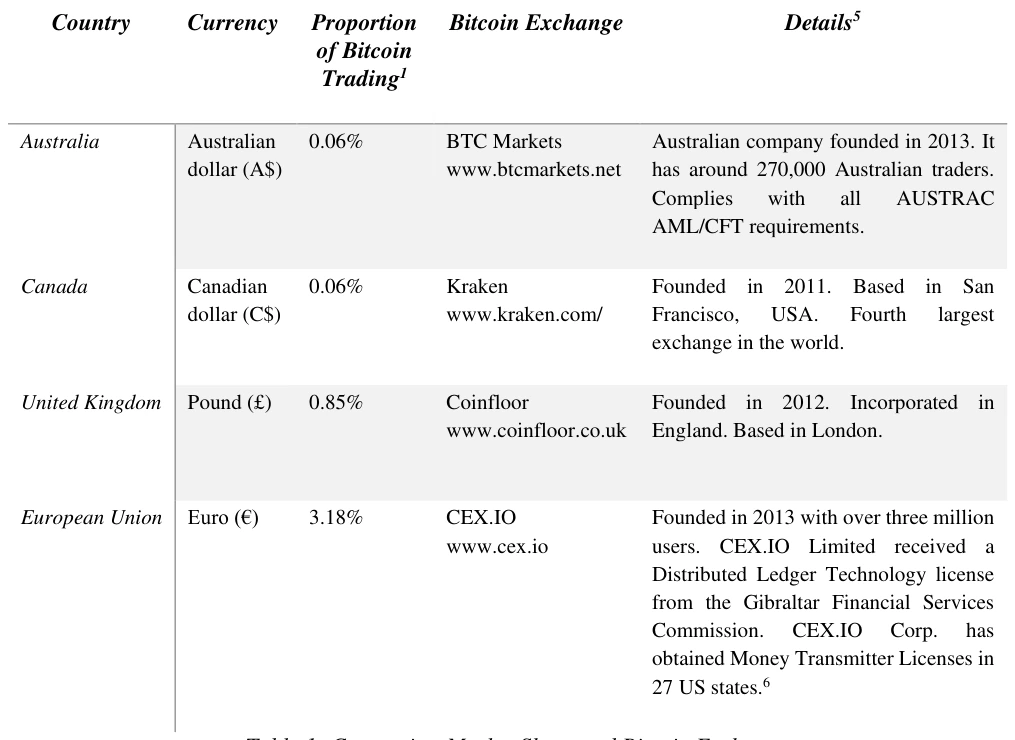
Although Bitcoin trading in US dollars represents approximately 73%4 of the Bitcoin market, a significant number of the world’s population do not have access to US dollars or US dollar bank accounts, to be able to enter this market. Consequently, here the focus is on four currencies with active but small markets and their experience before and during COVID-19. Table 1 details the currencies, their market share and the Bitcoin Exchange from which transaction data is taken, to be used in this analysis. Data is limited to that publicly available on bitcoincharts.com.
4 Taken from Coinhills website 25/9/2020. https://www.coinhills.com/market/currency/.
Accessible table text
| Country | Currency | — | Proportion | — | Bitcoin Exchange | Details5 | — | — |
|---|---|---|---|---|---|---|---|---|
| — | — | — | of Bitcoin | — | — | — | — | — |
| — | — | — | Trading1 | — | — | — | — | — |
| — | — | — | — | — | — | — | — | — |
| Australia | Australian dollar (A$) | 0.06% | 0.06% | — | BTC Markets www.btcmarkets.net | — | Australian company founded in 2013. It | — |
| — | — | — | — | — | — | — | has around 270,000 Australian traders. | — |
| — | — | — | — | — | — | — | Complies with all AUSTRAC | — |
| — | — | — | — | — | — | — | AML/CFT requirements. | — |
| — | — | — | — | — | — | — | — | — |
| Canada | Canadian 0.06% Kraken Founded in 2011. Based in San dollar (C$) www.kraken.com/ Francisco, USA. Fourth largest exchange in the world. | — | — | — | — | — | — | — |
| United Kingdom | Pound (£) | 0.85% | — | — | Coinfloor www.coinfloor.co.uk | Founded in 2012. Incorporated in England. Based in London. | — | — |
| European Union | Euro (€) 3.18% CEX.IO Founded in 2013 with over three million www.cex.io users. CEX.IO Limited received a Distributed Ledger Technology license from the Gibraltar Financial Services Commission. CEX.IO Corp. has obtained Money Transmitter Licenses in 27 US states.6 | — | — | — | — | — | — | — |
Two periods are used to gauge Bitcoin trading activity before and during COVID-19. May-November 2019 represents the pre-COVID-19 period and February-August 2020, a time when the world is in the grip of COVID-19, which is for convenience referred to here as post-COVID-19. December 2019 and January 2020 are omitted from the analysis as knowledge of the pandemic and the disruptions to come are not widely known or understood during this period.
For each currency, trading in restated in local time and basic metrics are calculated, both at the transaction and daily levels and the Kruskal-Wallis (KW) test is used to determine the significance or otherwise of any differences between the two periods. All the price data is kept in local currency so the economic impact of the virus is also reflected in the value of each local currency.
5 Details taken from each exchange’s website. 6 CEX.IO LTD has applied for a Digital payment token service license with the Monetary Authority of Singapore and for a Crypto Custody license with the Federal Financial Supervisory Authority of Germany.
3. Analysis
Each currency is discussed separately and differences in the two periods are evaluated.
3.1. Bitcoin Trading in the Australian Dollar on BTC Markets
Basic transaction details, in Table 2:A indicate that Bitcoin trading in the Australian dollar declines in the post-COVID-19 period. However, the KW test statistic (all of which are detailed in Table 3) indicates that the number of transactions per day (Table 3:B:1) is not significantly difference across the two periods, although Bitcoins traded per transaction does decline in the February to August post-COVID-19 period (Table 3:A:1).
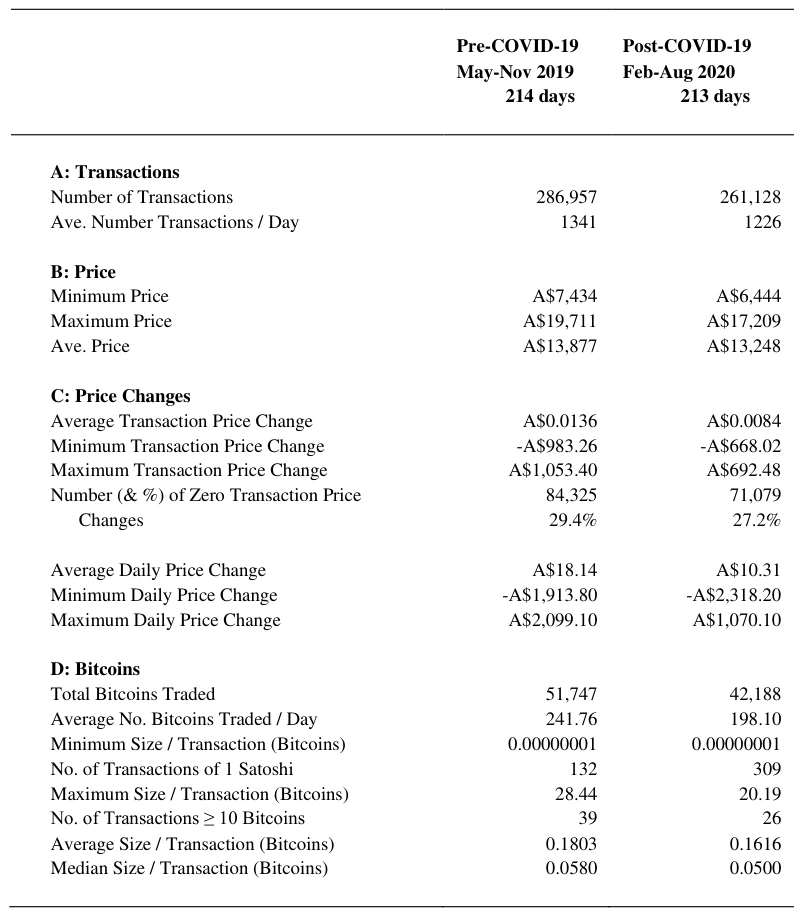
The Bitcoin price in Australian dollars (Table 2:B) also declines during the pandemic which the KW test indicates is significant (Table 3:A:1). Price changes between transactions is significantly larger in the pre-COVID period but price changes on a daily basis are not significantly different (Table 2:C, Table 3:A:2 & B:2). In each of the two periods approximately one quarter of transactions are unchanged from the previous transaction’ price. (Table 2:C:4)
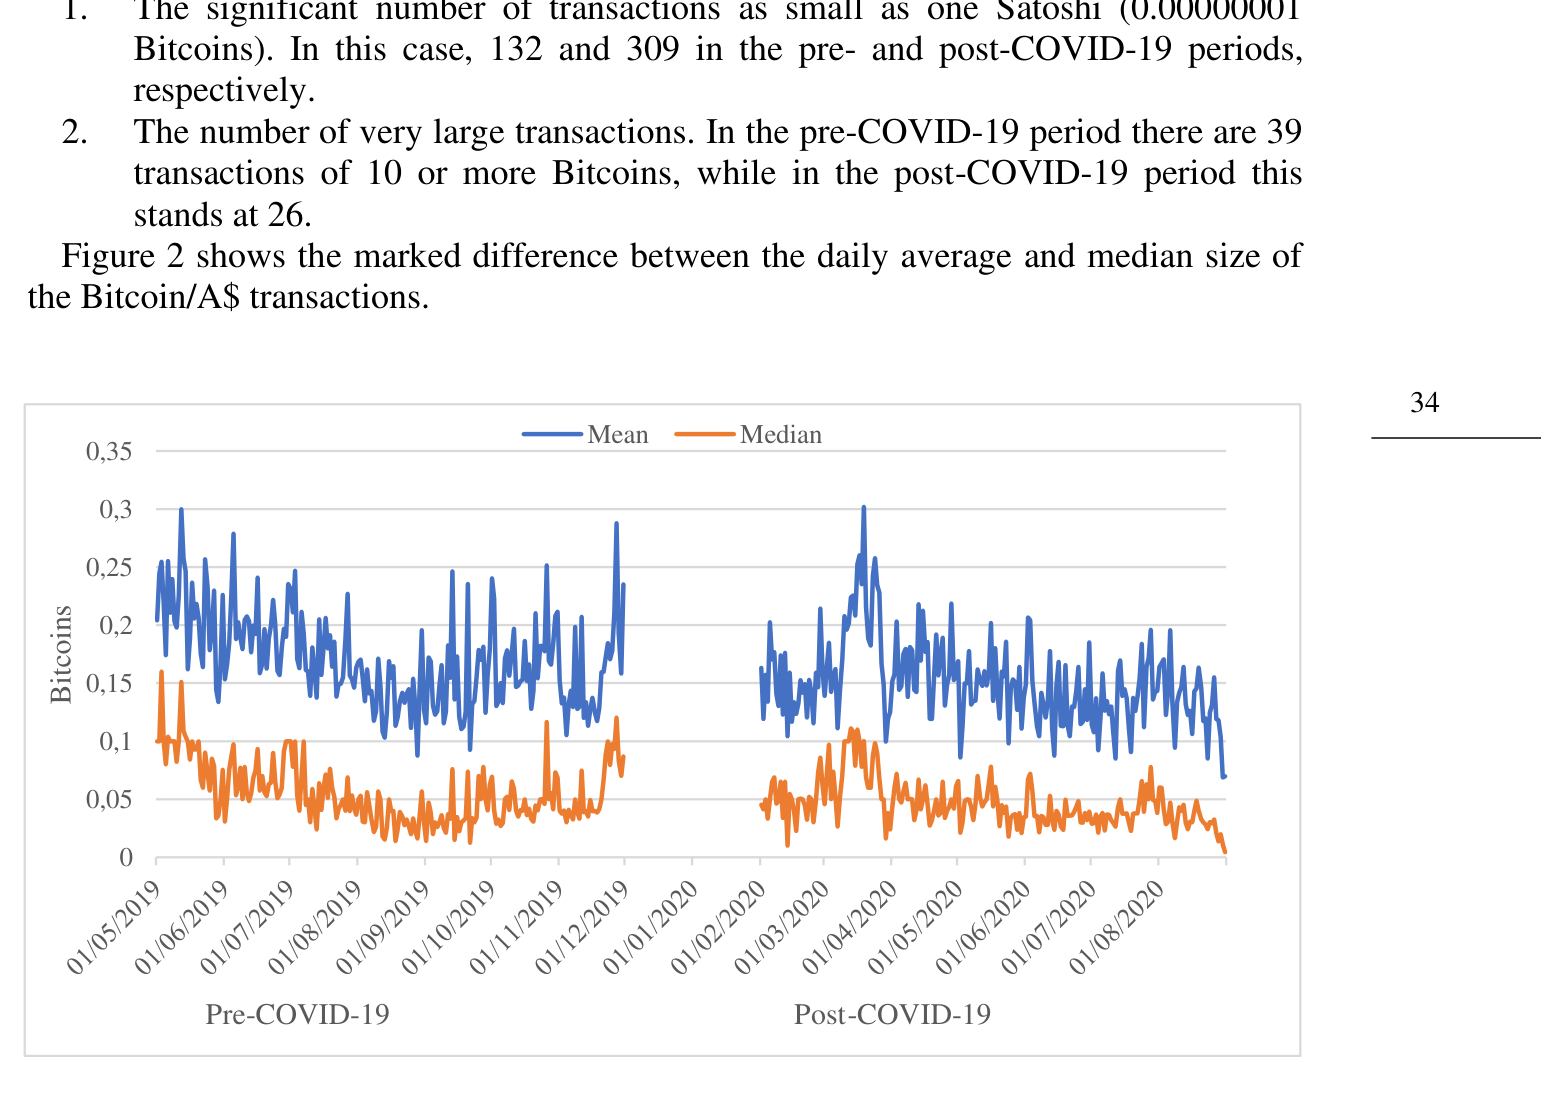
When it comes to the size of the trades (in Bitcoins) the KW test indicates that both the average and mean daily trade size (Table 2:D) are largest in the pre-COVID period, though the daily maximum trades are no different in the two periods (Table 3:A:4-7). Any judgement about the average size of trades needs to take into account the influence of a few very large transactions and a better understanding of trade size should be based on the median rather than the mean. Two factors influence this recommendation:
In the Australian dollar market, Bitcoin trading decreases, as does the number of Bitcoins traded, in the post-COVID-19 period (Table 2:D:1). There is no evidence of any increase in Bitcoin trading implying that Bitcoin is not being used as a safe haven in Australia, during the economic upheaval of the pandemic.
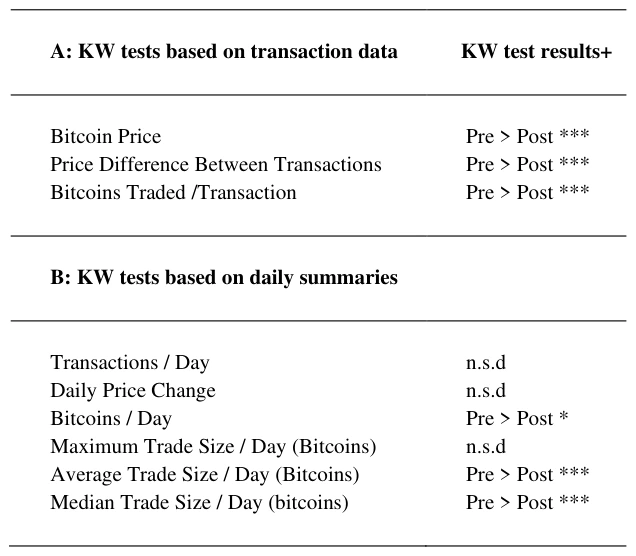
As far as trading Bitcoin in Australian dollars is concerned the pre-COVID-19 periods dominates trading activity, even though the Bitcoin price declines in the Australian dollar market.
3.2. Bitcoin Trading in the Canadian Dollar on Kraken
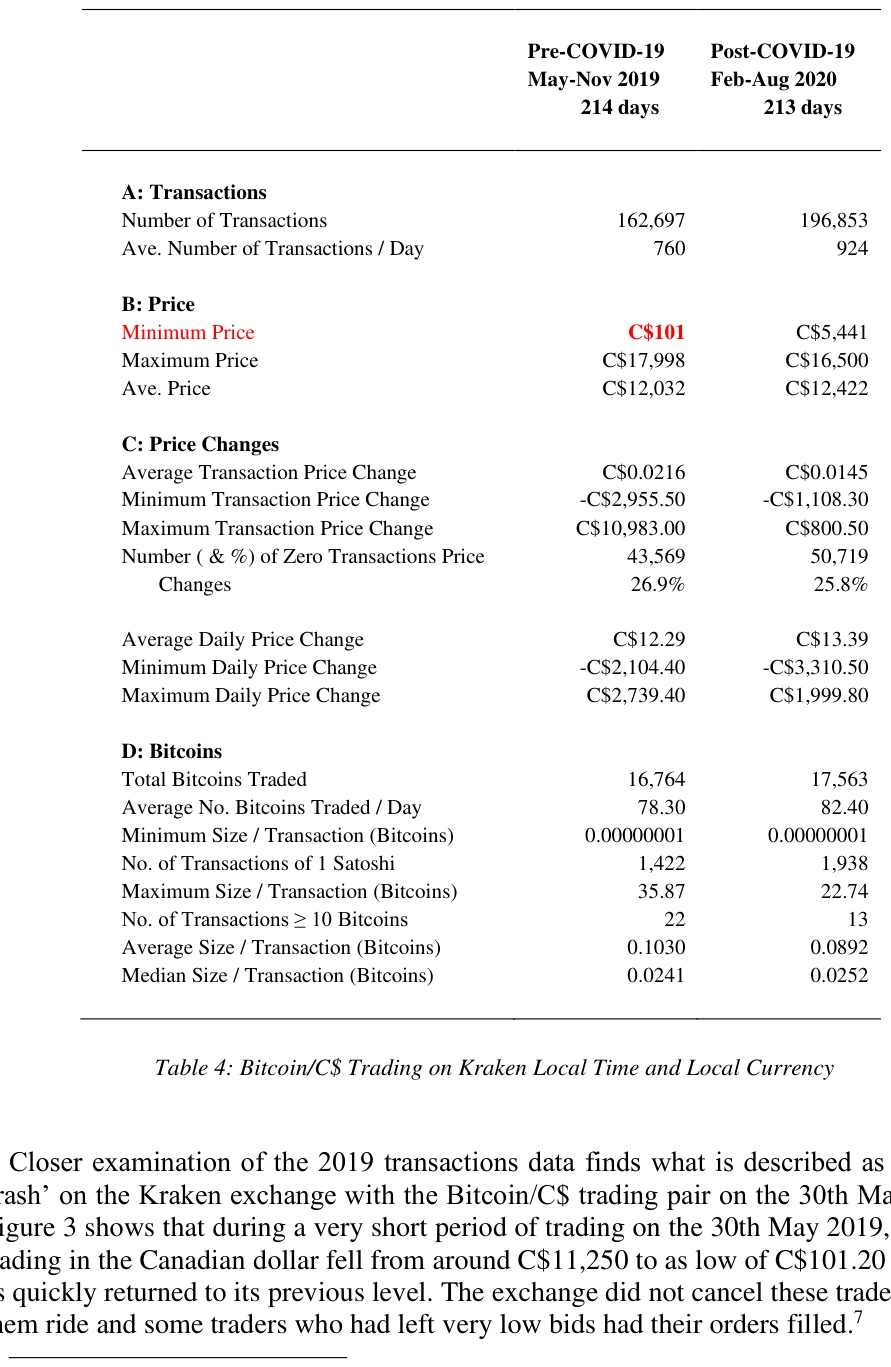
Details provided in Table 4:A:1 & 2 indicate that Bitcoin trading in the Canadian dollar increases in the post-COVID-19 period. This is supported by the KW test statistic in Table 5:B:1, which assesses transactions per day as significantly greater during the post-COVID-19 period.
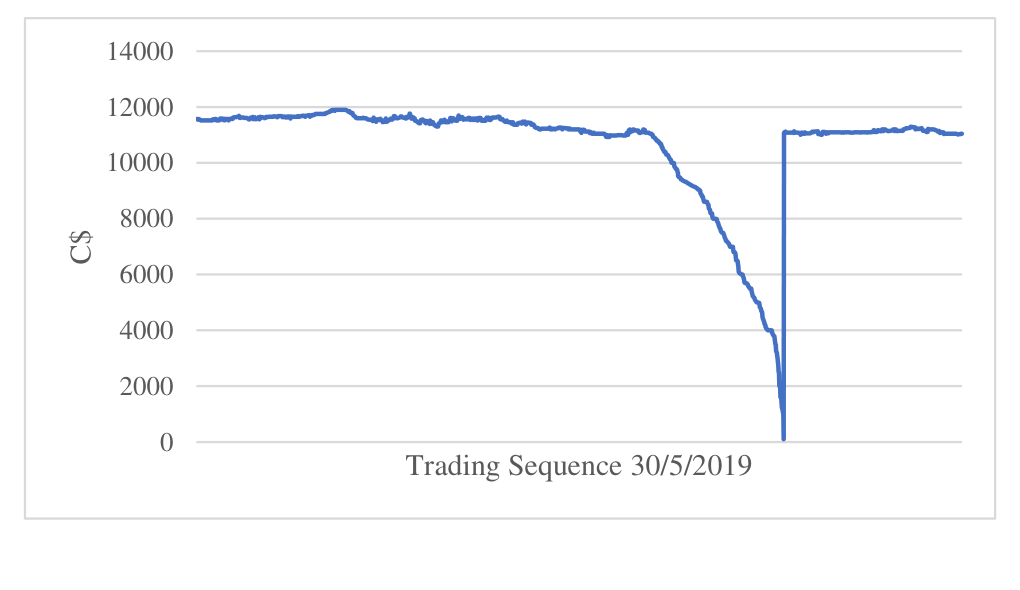
The minimum price for the pre-COVID-19 period, highlighted in red, in Table 4:B:1 is misleading but accurate and influences the outcome when assessing the Bitcoin price across the two periods which the KW test (Table 5:A:1) determines is significantly higher in the post-COVID-19 period.
7 Details of the ‘flash crash’ can be found at: “Bitcoin: a flash crash on Kraken causes the price to fall to $100” by Marco Cavicchioli. 3/6/2019. <https://en.cryptonomist.ch/2019/06/03/bitcoin-flash-crash-kraken-price/>. “Bitcoin to Zero: Bitcoin Price Flash Crashes 99% on BTC/CAD Trading Pair” by Tony Spilotro. 31/5/2019. <https://www.newsbtc.com/2019/05/31/bitcoin-price-flash-crashes-btc/>.
Although price changes from day to day are not significantly different across the two periods (Table 5: B:2) when measured between transactions, prices changes in the post-COVID-19 period are greater than in the pre-COVID-19 period (Table 5:A:2). Along with an increase in trading activity is an increase in the number of Bitcoins traded, though a large number of transactions are as small as one Satoshi: 1,422 and 1,938 in the preand post-COVID period, respectively (Table 4:D:4). Both the maximum and average size of trades are greater in the pre-COVID period (Table 5:B:4&5), the median trade size, a more accurate measure of central tendency, is not significantly different across the two periods (Table 5:B:6).
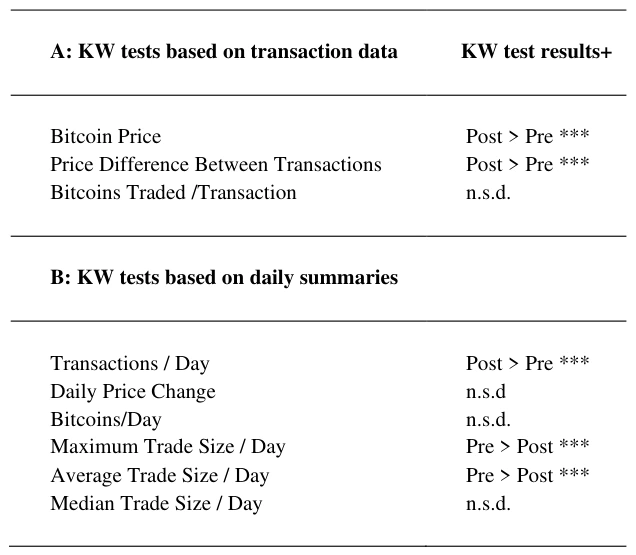
Trading Bitcoins for Canadian dollars on the Kraken exchange increased in the post-COVID-19 period as did the price difference between transaction, though the number of Bitcoins per transaction doesn’t vary. Trading may have increased but the overall size of the transactions decline during 2020, implying that increased trading did not mean larger trades.
3.3. Bitcoin Trading in the UK Pound on Coinfloor
Details provided in Table 6 indicate that trading Bitcoin/£ on Coinfloor increases in volume during the 2020 post-COVID-19 period, which the KW test statistic, Table 7:B:1, indicates is significant. However, the number of Bitcoins changing hands declines as does the average and median trade, size (Table 6:D:1,7&8 and Table 7:A:3, B:5&6), even though the Bitcoin price in pounds declines in the post-COVID-19 period.
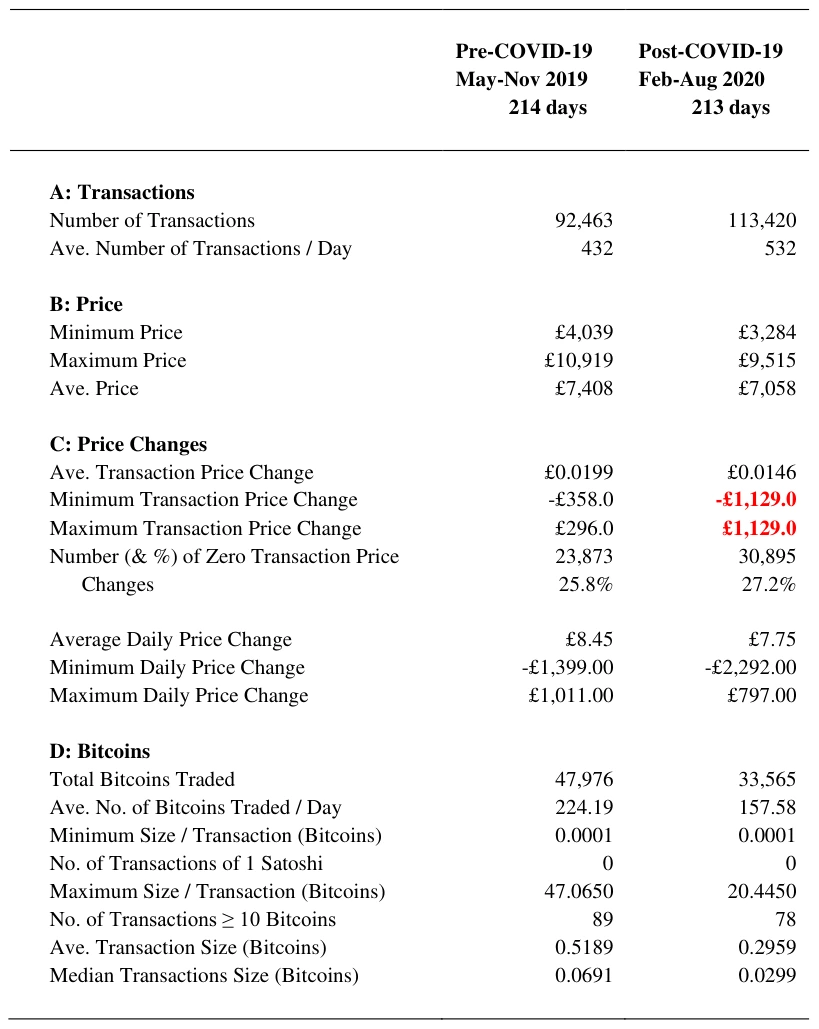
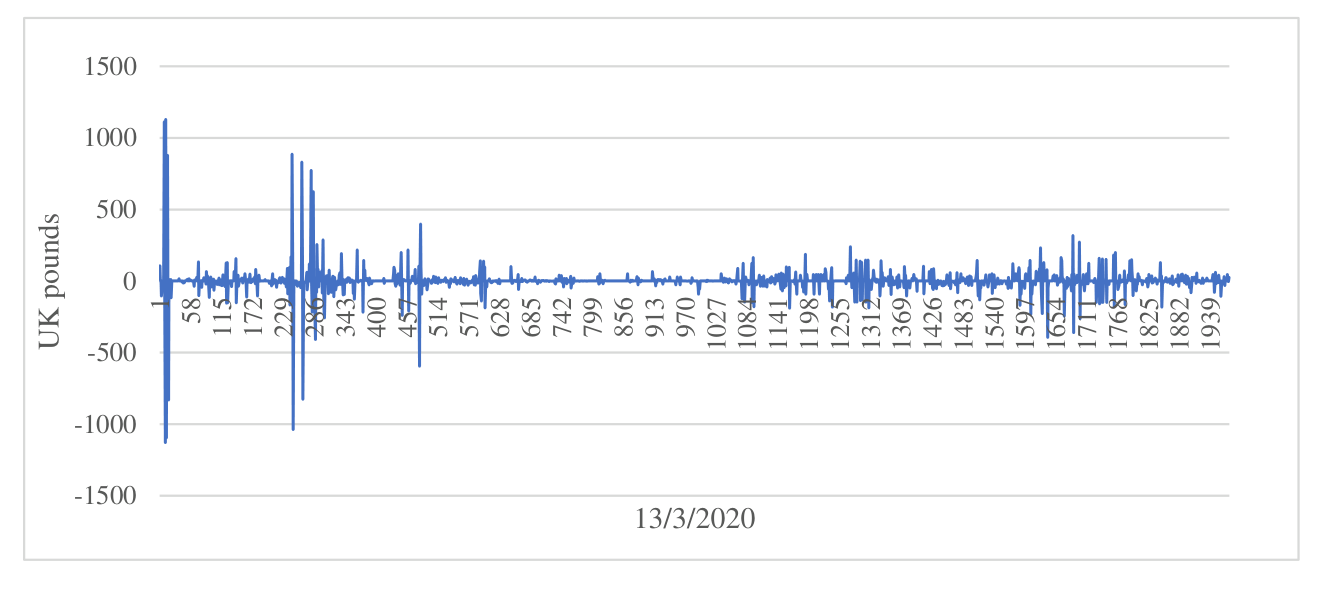
Of particular interest are the maximum and minimum transaction price changes of £1,129 and -£1,129 respectively, in the post-COVID-19 period. These are highlighted in red in Table 6. Figure 4 shows the sequence of trades on the 13th March 2020 in which the £1,129 price change occurs. This is at a time when the Bitcoin price is, as noted previously, shadowing the US S&P 500 during a particularly volatile period. Over this period there are continual price reversals of the S&P 500 and the Bitcoin price. This is easily seen in the trading sequence on the 13th March 2020 as shown in Figure 4.
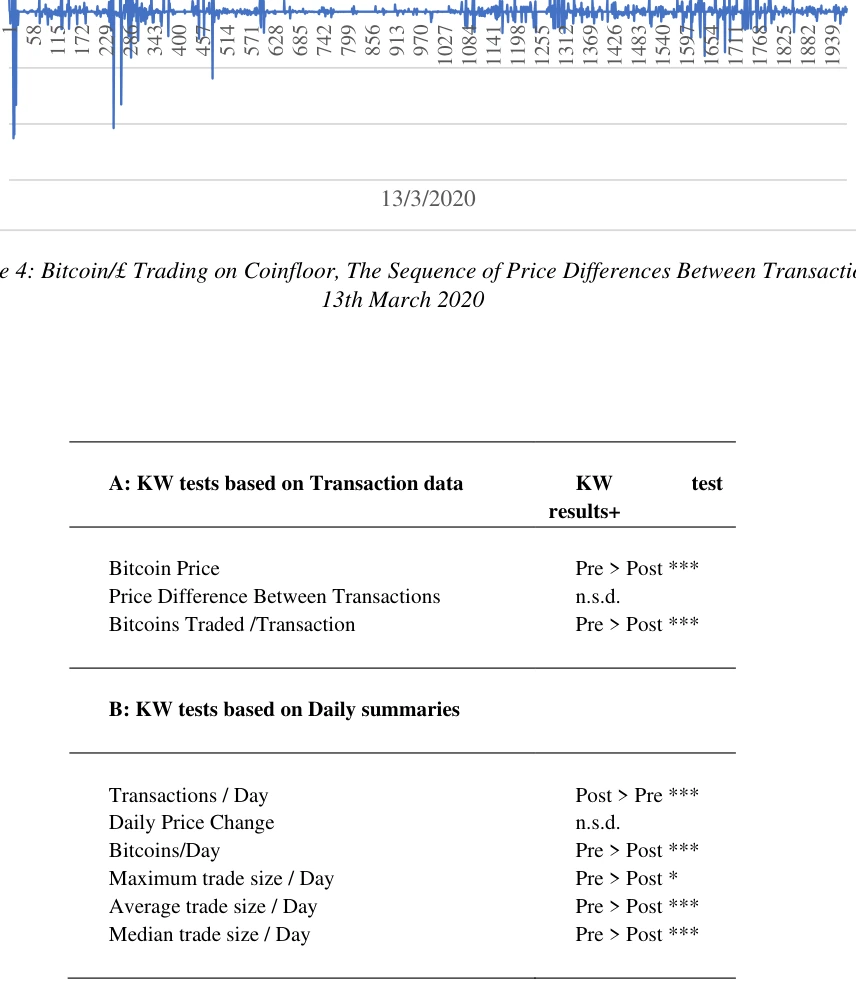
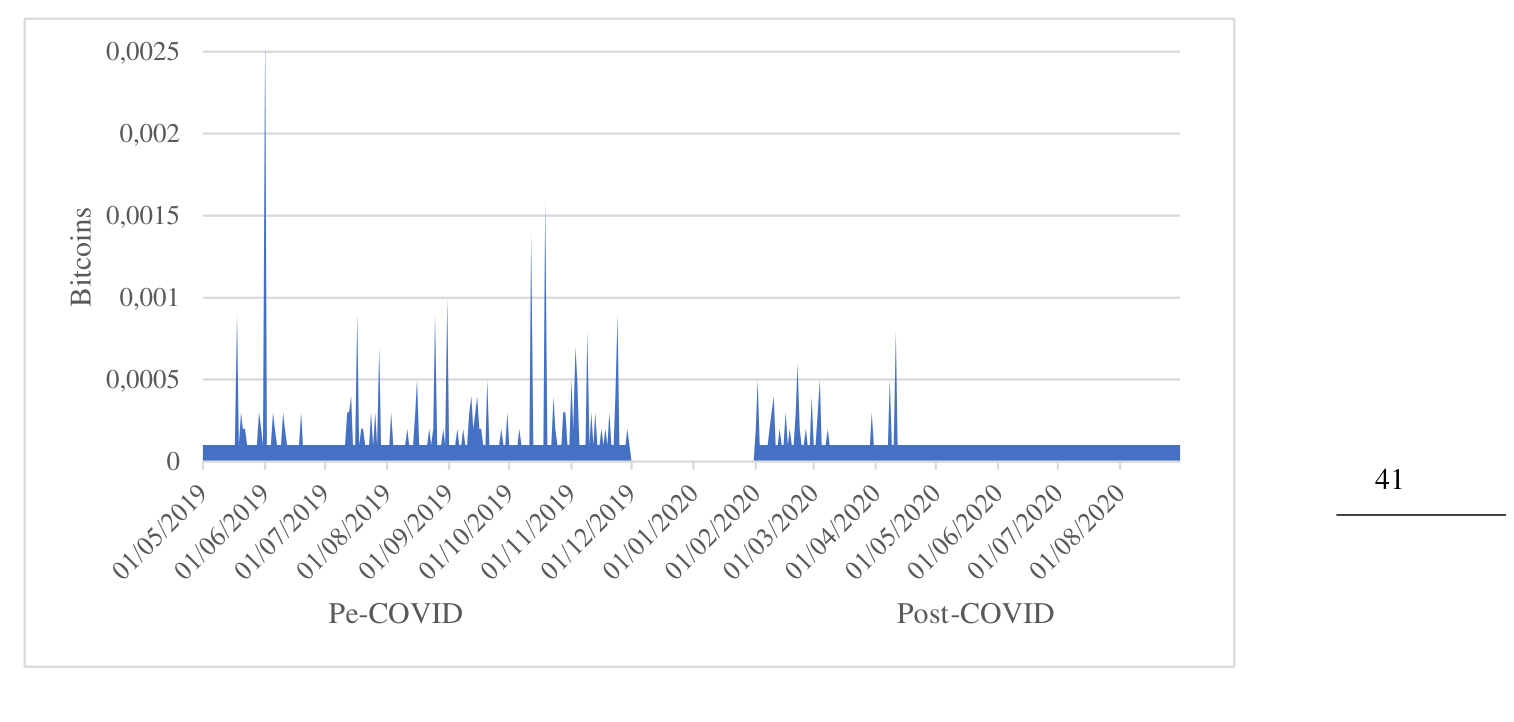
One other metric of note in Bitcoin/£ trading on Coinfloor is the minimum transaction size, which never drops below 0.0001 Bitcoin (Table 6:D:3). Nowhere near the one Satoshi level of the Australian dollar and Canadian dollar trades. Reading through Coinfloor’s website, there does not appear to be any limitation placed on the size of trades but the fee structure would imply that anything smaller than 0.0001 Bitcoin would cost more in fees than the trade itself. Figure 5 is the daily minimum trade size for the pre- and post- COVID-19 periods. The minimum size drops away to 0.0001 Bitcoins from April 2020 as the average and median trade sizes also decrease. (Table 6;D:7&8 and Table 7:B:5&6).
3.4. Bitcoin Trading in the Euro on CEX.IO
From Table 8:A:1 it can be seen that unlike trading in the Australian and Canadian dollars and the pound, trading in the euro on the CEX.IO exchange experiences a significant increase in the post-COVID-19 period, over 100% above the pre-COVID-19 level. The increase in the level of Bitcoins changing hands is not quite at this level with the post-COVID-19 amount approximately 50% greater than in the pre-COVID-19 period. Together with this increase in trading we witness an increase in the euro price of Bitcoin in the post-COVID-19 period.
In terms of the difference in the price between transactions, there is no significant difference, nor any difference between daily price changes between the two periods.
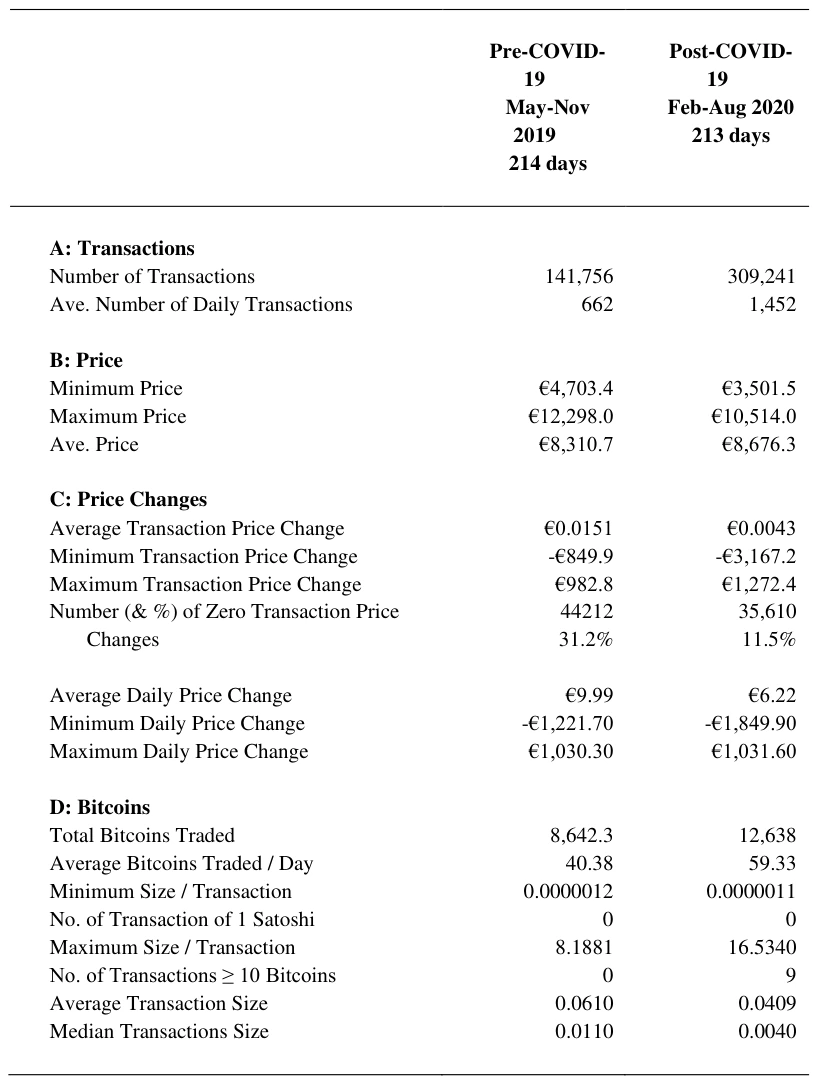
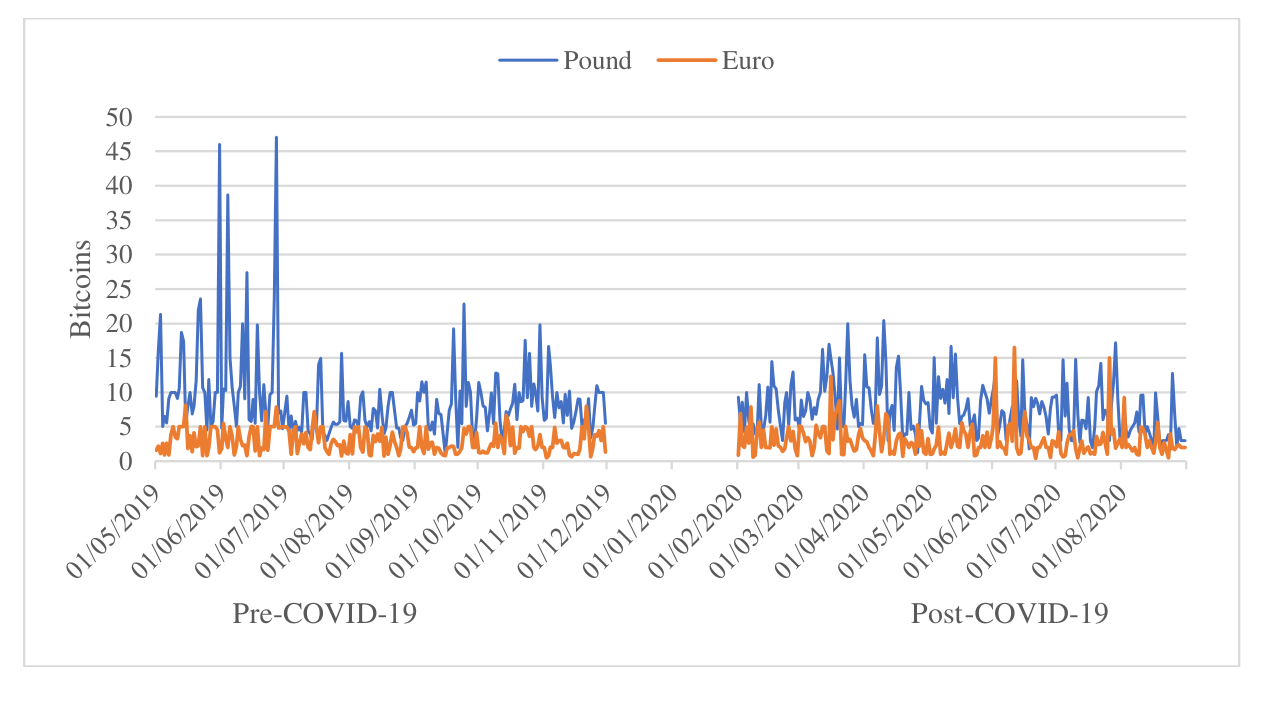
What is notable is the size of the Bitcoin transactions. Unlike trading in the Australian dollar, the Canadian dollar or the UK pound, no euro transactions in the pre-COVID-19 period exceed 10 Bitcoins. There are only nine transactions in the whole post-COVID-19 period that exceed this amount. Figure 6 highlights the difference in the daily maximum between pound and euro trading. The minimum transaction size also exceeds the one
Satoshi evident in the Bitcoin trading in the Australian and Canadian dollars but is smaller than the 0.0001 Bitcoin evident with the Bitcoin/£ trading.
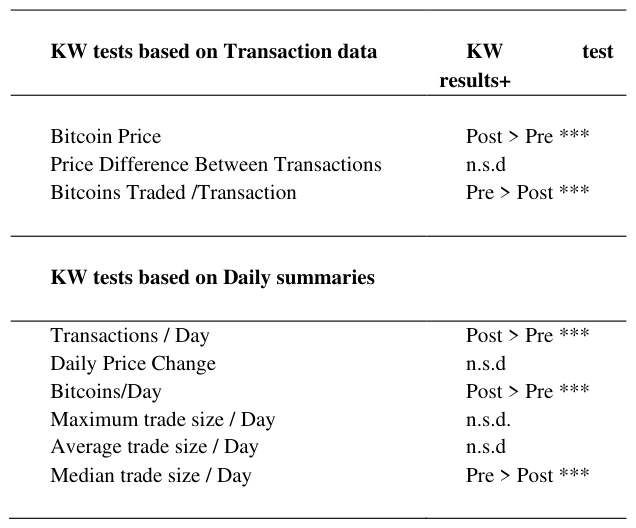
Patterns of trading in the euro are mixed. In the post-COVID-19 period, the Bitcoin price is higher as are the transactions/day and the Bitcoins traded each day. In the pre-COVID-19 period Bitcoins traded per transaction are greater as is the median trade size.
4. Summary
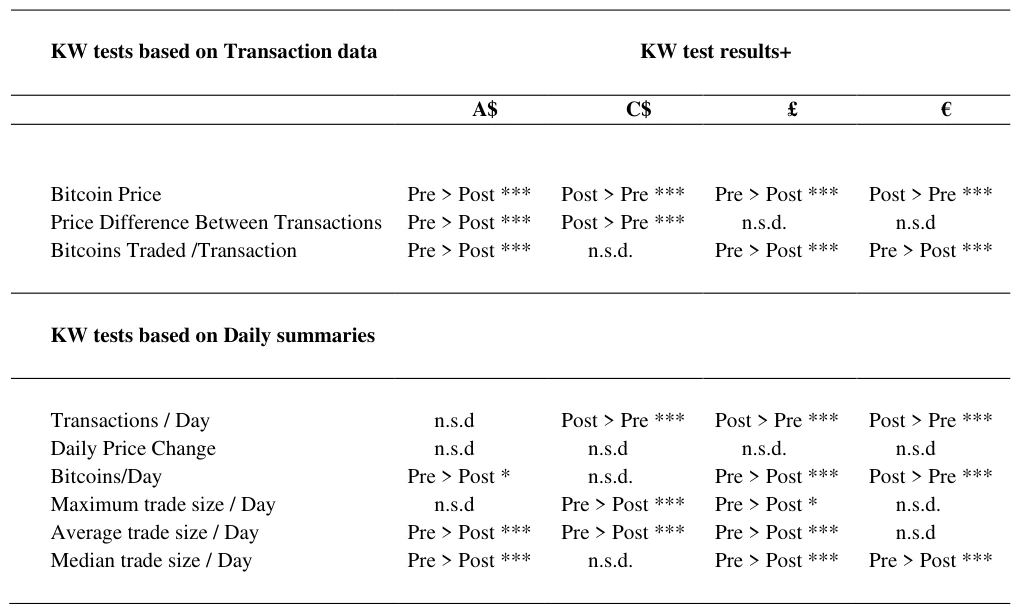
From Table 10, the first observation when comparing across currencies is the lack of any consistent pattern. No two currencies are the same. The pre-COVID-19 period dominates in the Australian dollar market. The UK pound is similar except for transactions/day which is higher post-COVID-19. In the Canadian dollar and euro markets neither period dominates with each currency finding ‘not significantly different’ for a number of metrics. Surprisingly there is not even any consensus with regard to the Bitcoin price which decreases in the Australian dollar and the UK pound market in the post-COVID-19 period while this period sees an increase in the Bitcoin price in the Canadian dollar and euro markets, indicating that local currencies are factoring in local economic conditions.
5. Conclusion
Observing Bitcoin trading behaviour in one currency does not indicate patterns of trade in another currency. Though the Bitcoin price in US dollars may be the universal benchmark price, each currency will reflect the economic conditions in the country concerned, which in turn will influence local Bitcoin trading patterns. This is particularly evident when comparing Bitcoin trading across countries with very different economic conditions during a period of worldwide economic uncertainty as the COVID-19 pandemic continues to take a toll on local economies.
Funding The research received no specific grant from any funding agency in the public, commercial, or not-for-profit sectors.
Conflicts of interest The author(s) states that there is no conflict of interests.